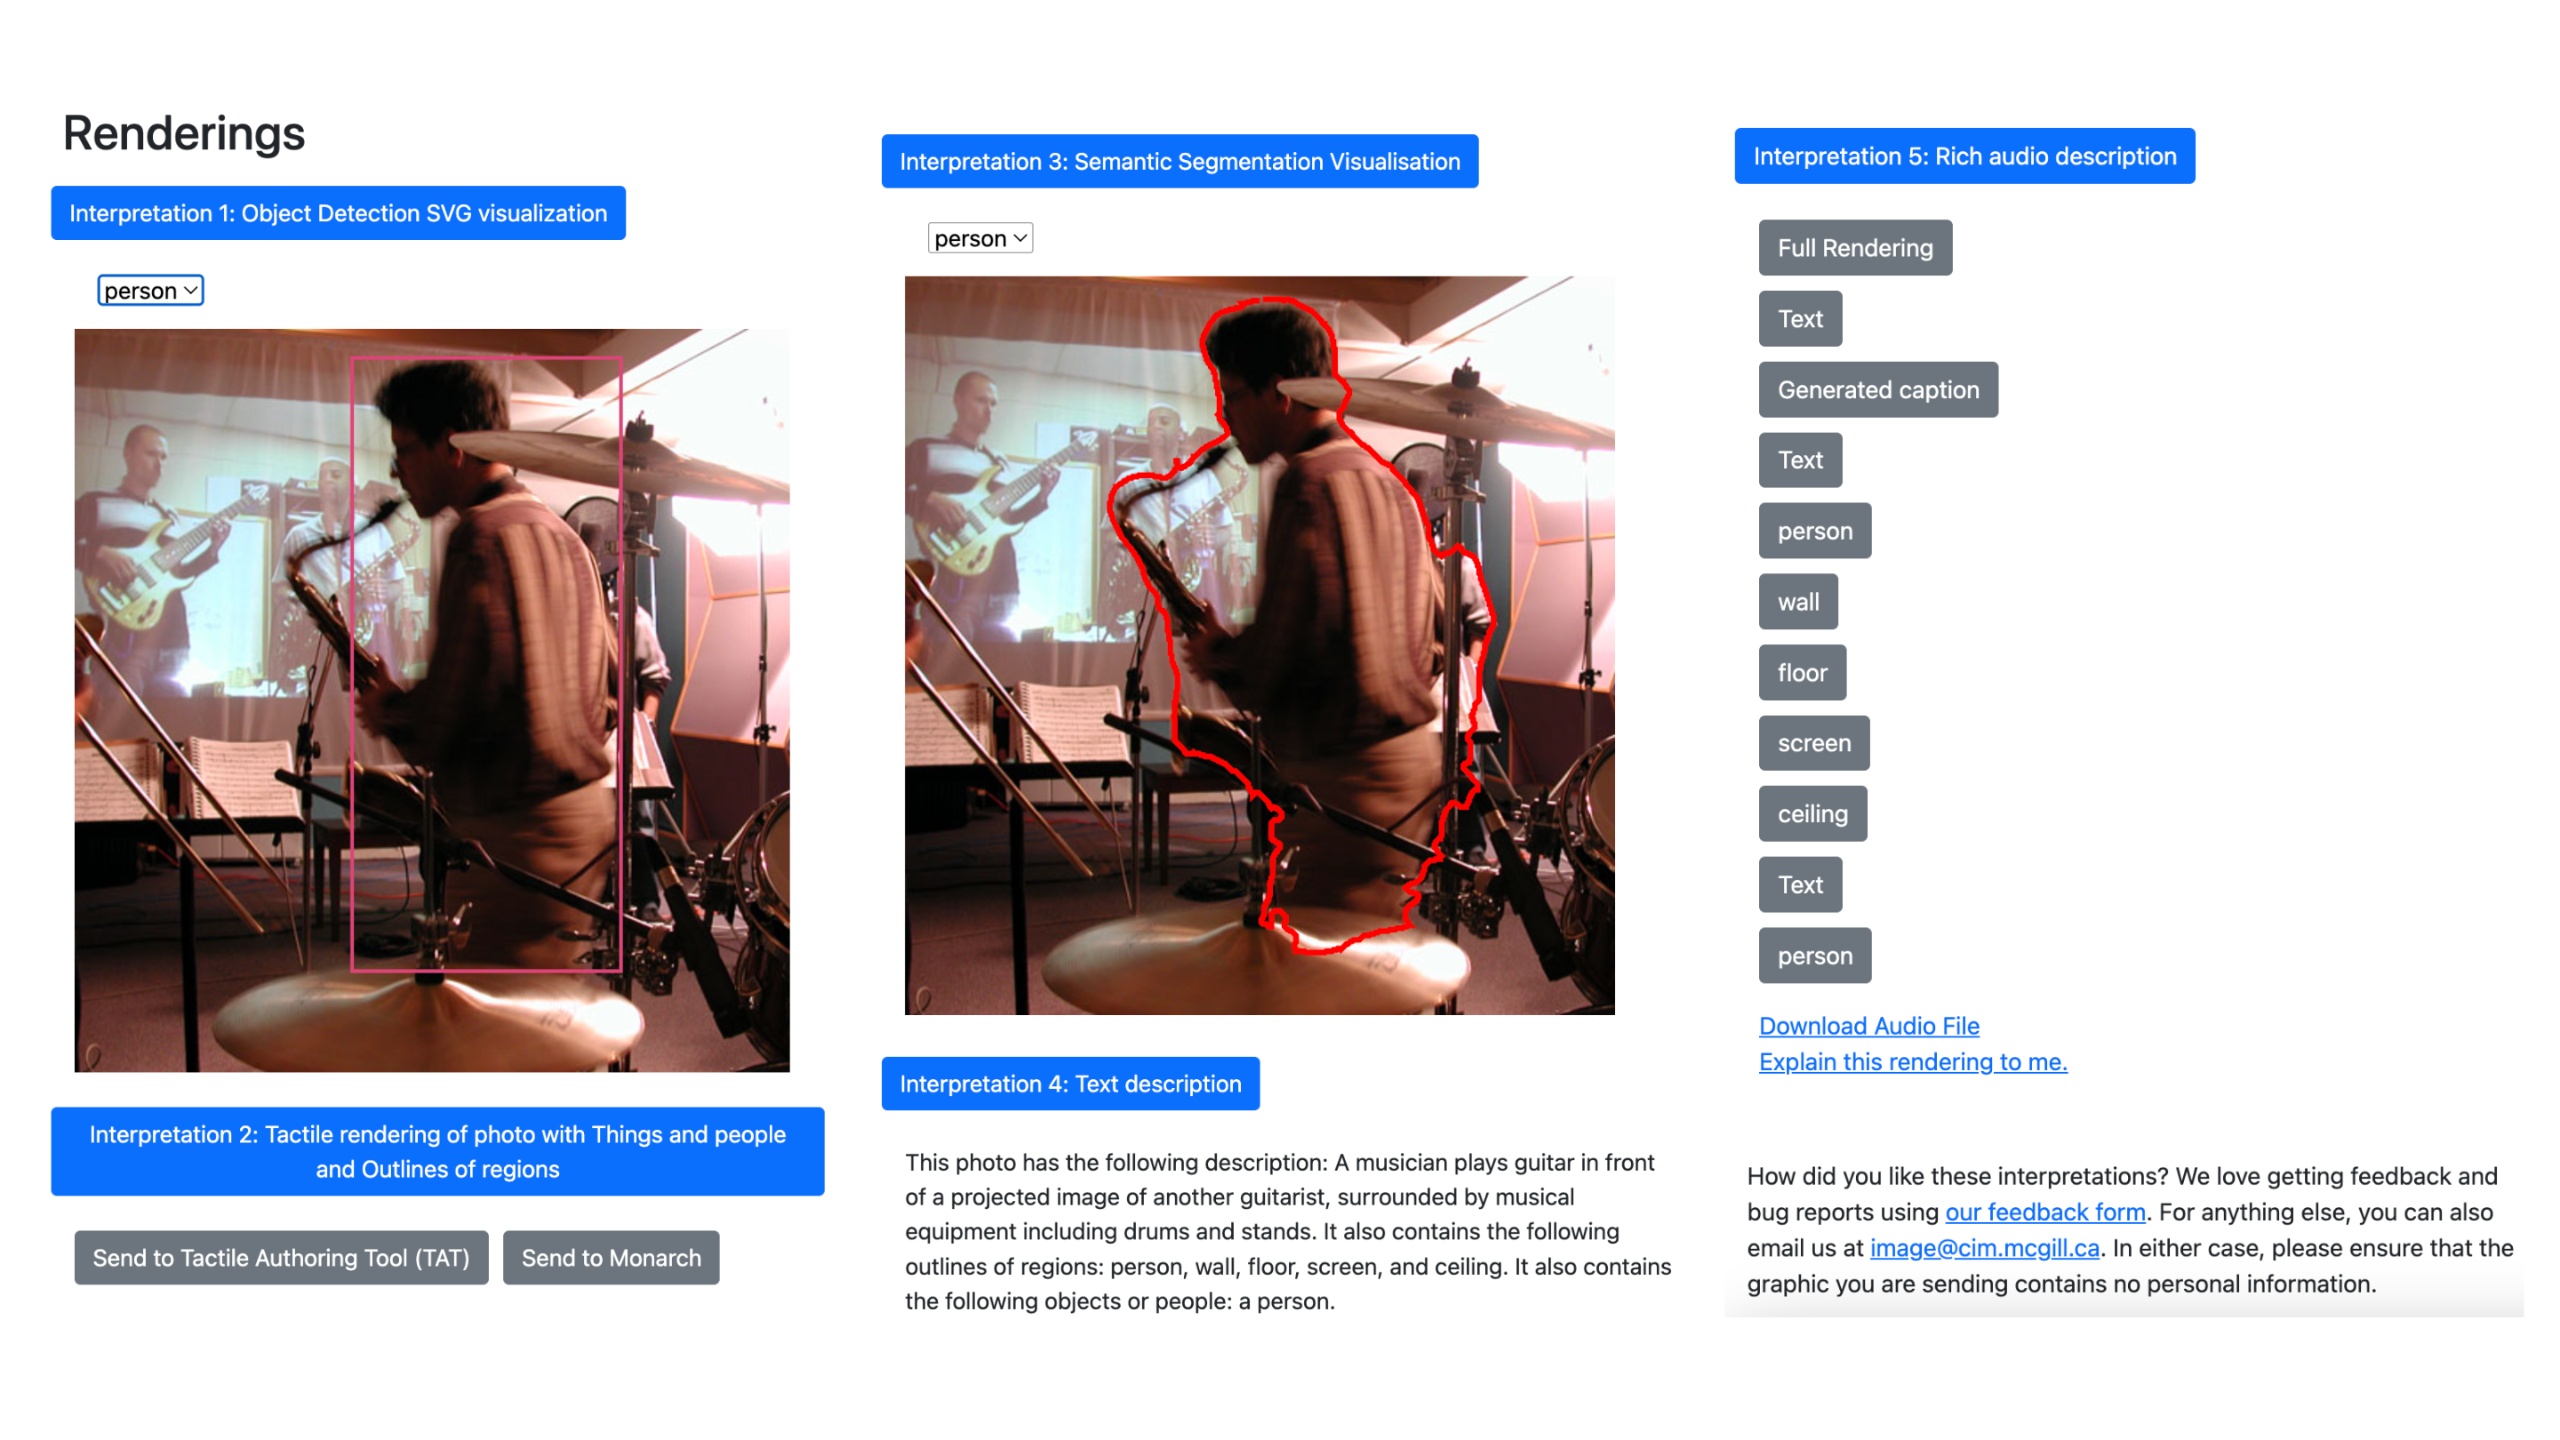
IMAGE Project: Tutorial

How do I use IMAGE?

Overview, controls, installation and hardware

To use IMAGE, install the extension into your web browser, and a new context menu item "Get IMAGE Rendering" will appear when you open a context menu (right-click, or keyboard equivalent for your operating system) on graphics, and a button labelled "Get IMAGE Rendering" will appear on embedded Google maps. These two features will let you choose a specific graphic for which you would like to have a richer experience. By selecting "Get IMAGE Rendering", you'll send the graphic to the IMAGE server. The IMAGE server then sends back one or more interpretations which are presented to you either through audio, text, or haptics. Because the actual graphic is sent to a server, be sure to never use IMAGE on graphics that may contain sensitive or personal information.

For the best experience listening to the renderings, please use stereo headphones. Additionally, if you wish, you can use haptic devices with IMAGE. This is a work in progress, and entirely optional, but will enhance the experience! You can use either the Haply 2diy, or a Dot Pad. To for a more in-depth explanation of these devices, see our Technology page.

Interpreting renderings

Photos

IMAGE interprets photos as being comprised of two broad classes: the first is regions, the second is things and people.

Regions

Regions are broad areas of photos made up of similar objects, like trees in a forest, or large things, such as a wall or floor. This is to give you an idea of where the larger components of the photo are relative to other elements of the graphic, rough shape, and spatial extent.

This is what three regions sound like together:

To understand what you are hearing or feeling, imagine that, using the buzzing sound, you are stretching your arm out in front of you to feel the very edge of the region, and tracing the contours of the edge clockwise left to right, with the pitch changing as it traces down and up.

Things and people

Things and people are found by our object detection programs. Things tends to encompass a wide range of objects, and people are humans. These will generally be grouped together.

Here is an example of things and people:

There were two different thing groups, as well as people being identified in this graphic, and you should have heard their relative locations in the scene as popping noises.

Try it out: A bear in the woods

A black bear in a forest.

To run IMAGE:

  1. Tab to navigate to the graphic
  2. Similarly to how you would open a context menu on a link to bookmark it, open a context menu on the graphic.
  3. Activate Get IMAGE Rendering. You will be notified when when the graphic is sent, when the data is being processed, and when the renderings window opens up.
  4. After a few seconds, a pop-up will appear with buttons labelled "Interpretation" followed by a number and a description. Click the buttons to get either text or audio representations of the graphic.
  5. You can play the rendering by pressing the Play button, or you can select the portion of the rendering you want to listen to using the dropdown menu.

Try it out: A busy street intersection

A street level view of downtown Toronto, at the intersection of Yonge and Queen Streets.

Try the same steps above on a more complex photo. Try to get a feeling for where all the things are in the photograph.

Maps

IMAGE uses embedded maps from Google Maps to create point-of-interest type renderings. If you are familiar with Shared Reality Lab's Autour project, this is similar, but also a little different.

Points-of-Interest

If the embedded Google Map has a latitude and a longitude, you will be able to hear the maps with a Points-of-Interest rendering. Imagine that you're standing at the location given by the latitude/longitude and you are facing north. You'll hear a little jingle in a direction relative to due North followed by the name of a place. The volume of the jingle indicates how close it is: louder if its closer, quieter if it's farther.

Here are 5 points of interest centered around a popular tourist spot in Toronto, Ontario. Two of them are to the right, one is behind, and the other two are to the left.

Try it out: The Royal Tyrell Musuem in Drumheller, AB.

Here's how you can get the Points-of-interest experience for an embedded Google map.

  1. Tab to navigate to the embedded map.
  2. Following the embedded map, there are a number of links that you can tab through. Continue tabbing until you find a button labelled "Get IMAGE Map Rendering".
  3. Activate the button "Get IMAGE Map Rendering".
  4. After a few seconds, a pop-up will appear with buttons labelled "Interpretation" followed by a number and a description. Click the buttons to get an audio representation of the points of interest around the center of the map.
  5. You can play the rendering by pressing the Play button.

You will hear the points of interest going around your head as if you were standing facing north on the map.

Charts

IMAGE can interpret graphs and charts made using Highcharts.

Line graphs

Currently, IMAGE can turn line graphs with a single variable into spatialized audio. You will hear title of the chart, followed by the website the chart is on, and the variable being measured. You will then hear a noise going left to right as it goes from the start of the x-axis to the end of the x-axis. The noise goes up in pitch as the value it represents goes up and the down in pitch as the value goes down.

Here is an example of what you will hear.


Try navigating to a Highcharts embedded chart. We have had pretty good luck with the ones on Etherscan.

  1. Tab to navigate to the chart.
  2. Following the chart, you will find a button labelled "Get IMAGE Chart Rendering".
  3. Activate the button "Get IMAGE Chart Rendering".
  4. After a few seconds, a pop-up will appear with buttons labelled "Interpretation" followed by a number and a description. Click the buttons to get an audio representation of the change in value.
  5. You can play the rendering by pressing the Play button.

Notice the pitch change as the value goes up and down.