IMAGE Project: Technology

How does it work?

Overview

On a user-facing level, IMAGE is a browser extension that adds a context menu item that will send a selected graphic to the IMAGE server.

As IMAGE utilizes spatial audio, stereo headphones are recommended for the best experience. Currently, IMAGE is working on supporting two different touch devices. First, on photos, we support the Haply 2diy, which consists of a knob attached to two arms. These arms allow you to move the knob anywhere on a flat horizontal surface, and allow you to feel boundaries and textures as you move. The second device, called the Dot Pad, is currently being integrated. It is a grid of thousands of individual pins that can be raised and lowered to render high resolution shapes and outlines. The video below explains a bit more about the touch technology we are using in this project.


Research and Implementation Areas

We have four main project axes:

  1. Machine Learning: Machine learning models extract useful information from the graphic, which could be the texture, colors, objects, people, chart values, etc.
  2. Audio Rendering: The information is mapped to rich audio and haptic renderings. We leverage text-to-speech (TTS) technologies, as well as audio spatialization techniques and audio effect generation, to produce a soundscape.
  3. Haptic and Multimodal Rendering: When haptic hardware is available, tactile information is also provided to enhance the audio cues. This allows the use of both hearing and feeling at the same time, with information conveyed simultaneously through both channels.
  4. Extensible architecture: Within the one year of this project, we know that we will not be able to do justice to all possible graphical content types. A key aspect of the project is to make sure that our designs and code are as freely accessible as possible, and extensible by others so new approaches and renderings can be easily incorporated without having to reinvent the wheel.

Architecture and Current Status

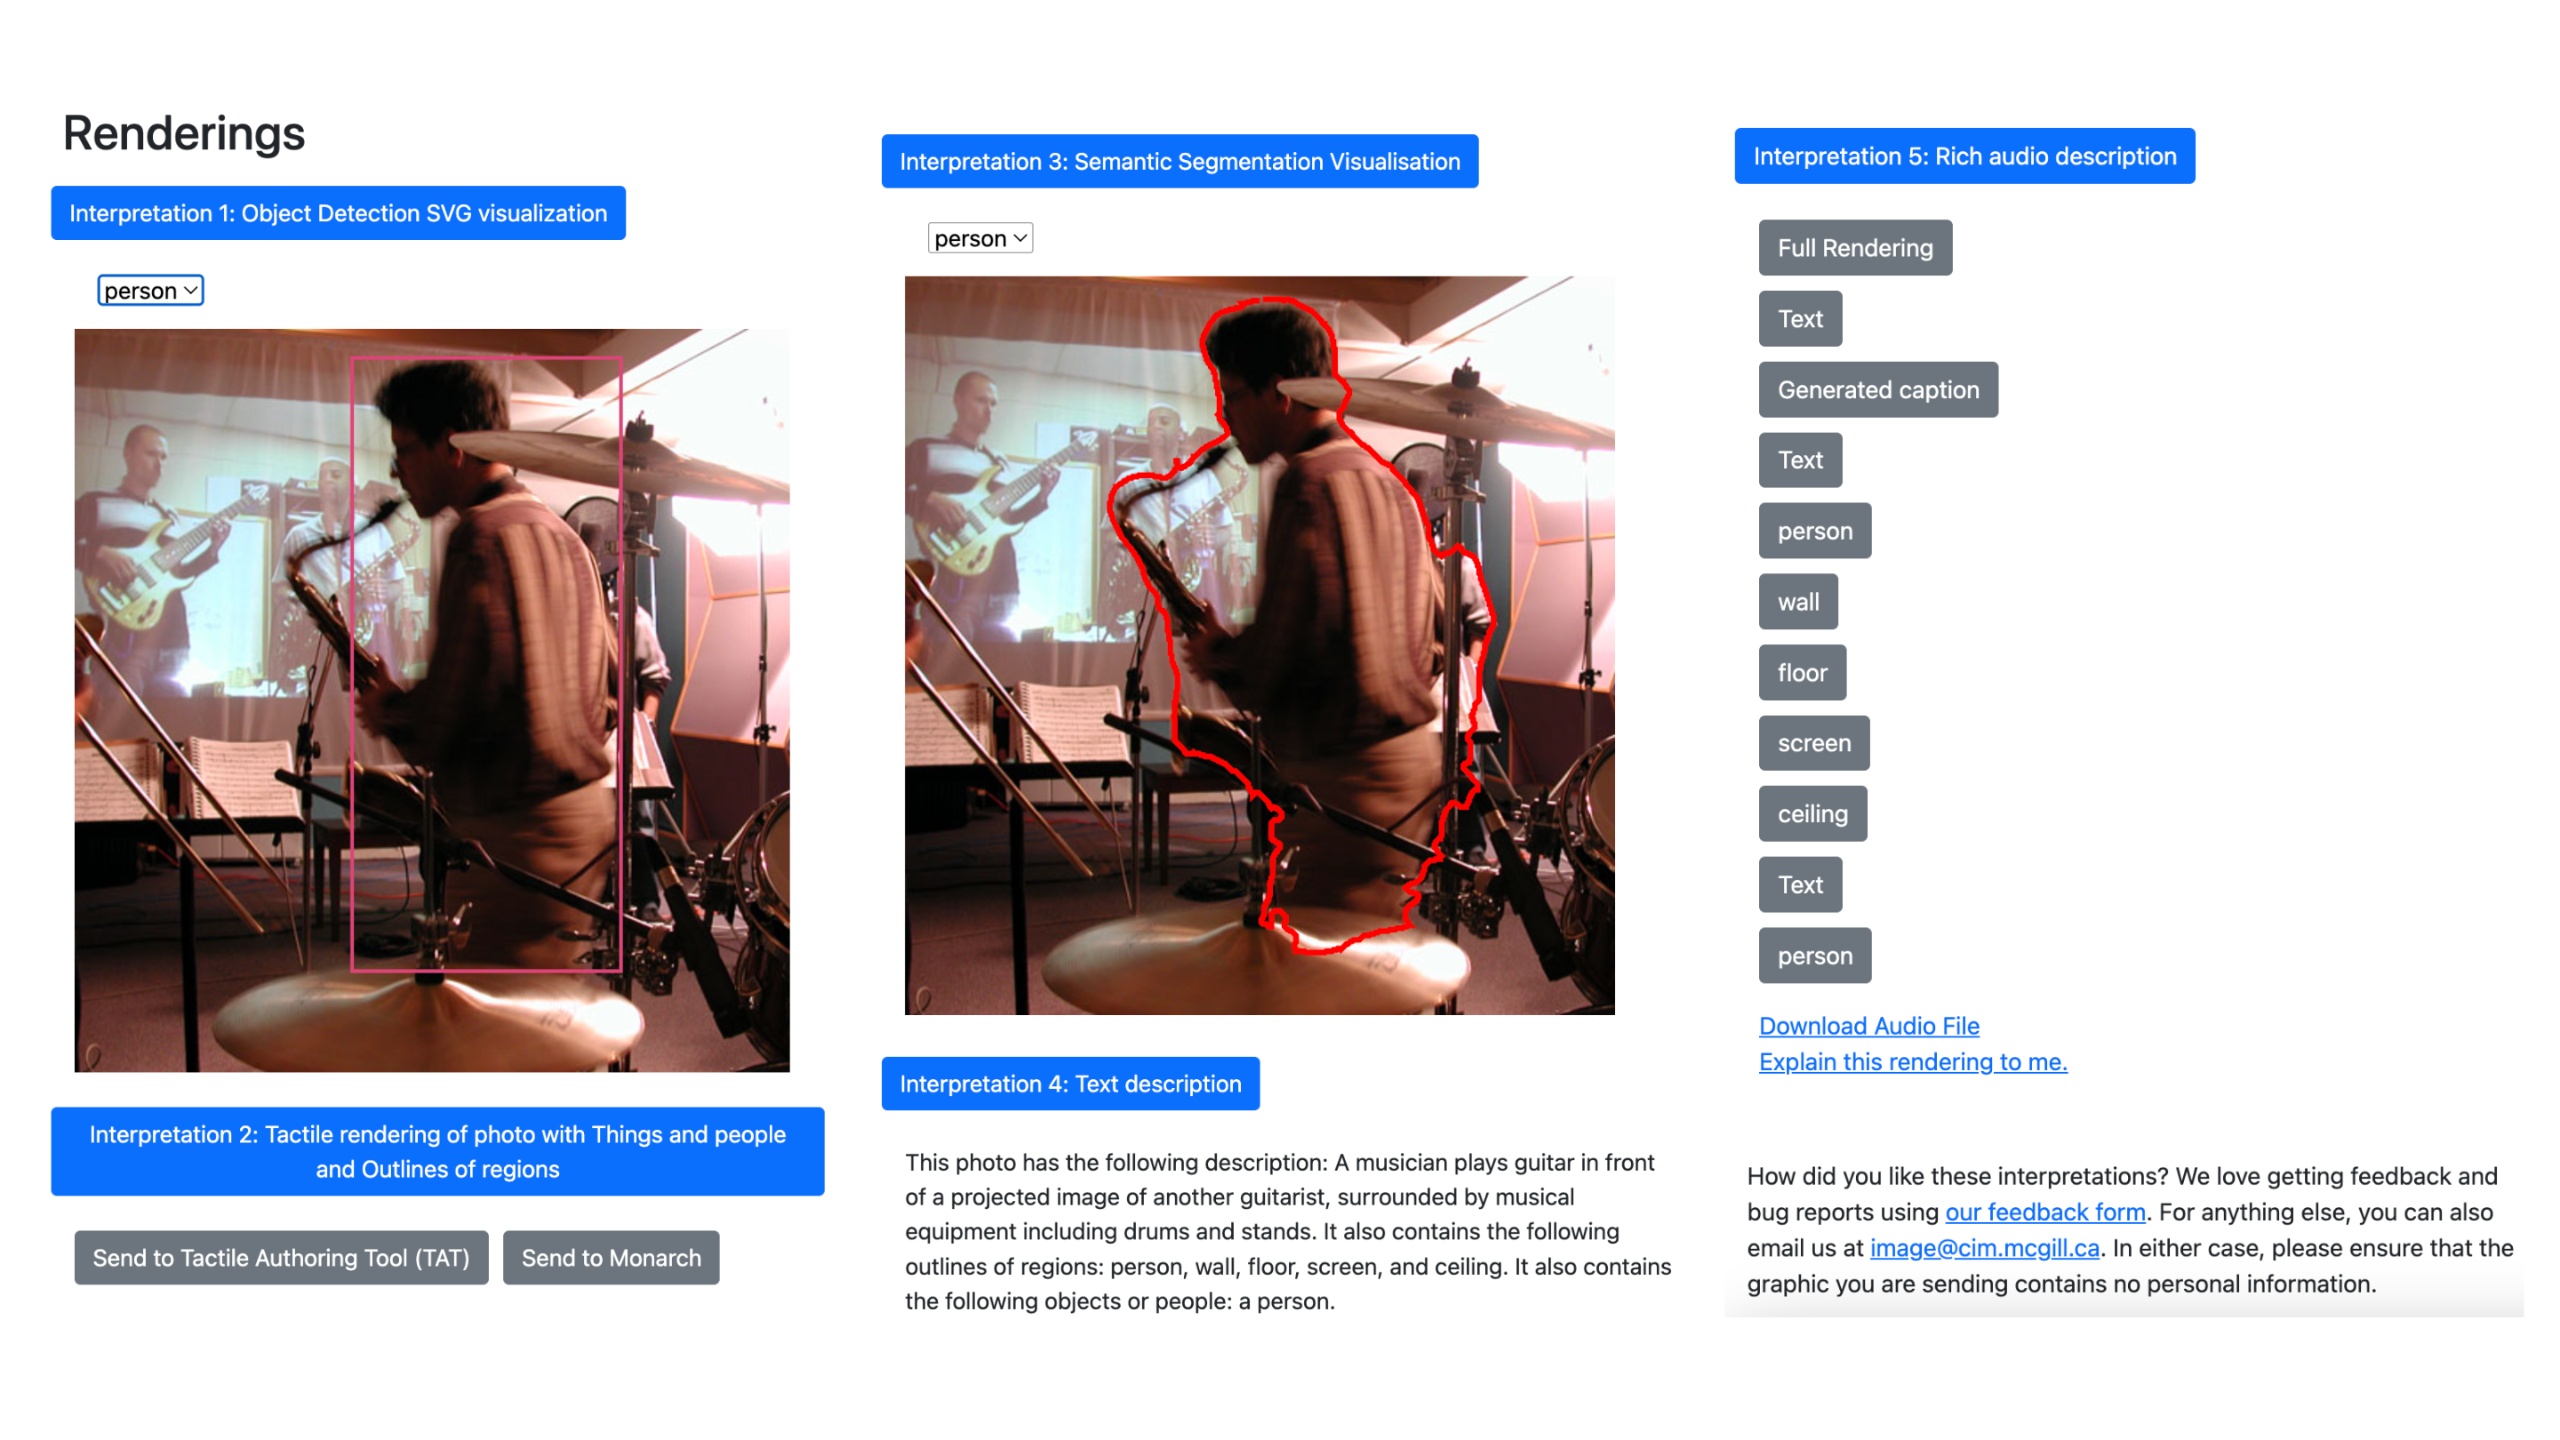
When the browser extension sends the chosen graphic to our server, machine learning tools first extract meaning from the graphic. This results in a large file in a format called json, that contains a structured text representation of everything the machine learning tools can interpret from the graphic. This json file is then ingested by software components we call "handlers" that create the actual audio and haptic experiences. The handlers use text-to-speech tools, and a sound rendering environment called SuperCollider, to create the rich recordings that are then sent back to the extension so the user can play them. For the software developers: download the code for your own software development projects, and also see our server GitHub repository for server code.

See a talk explaining the IMAGE framework and the paper.

We have a working Chrome browser extension that lets you send any image on the web to our server for processing, then receives the rendered experiences from the server and pops up a window to let you engage with them. The browser code can be downloaded here at our browser GitHub repository.. However, to give you a flavor for the technical state of the server right now, here are several audio recordings of the automated output from our system on some actual images taken from the web. These recordings are exactly what you would get if you used the IMAGE browser extension and our live server on March 2nd, 2022.

Photographs

Indoor, Regions and things

A modern industrial kitchen with a brick accent wall and an island.

Audio outlines are drawn around regions such as the floor and wall. Spatialized audio indicates where objects such as the glasses, bottles and chairs are.

Automated audio rendering


Outdoor, regions and things

A boat amongst mountains, trees, and a lake.

This is a simple picture of a mountain scene, with the audio spatialization informing you of the boats's location in the photograph relative to the water, sky and land.

Automated audio rendering

presentation of recognized objects in spatialized locations


Embedded maps

Point-of-interest

On embedded Google map, you can get a Points-of-interest experience; you will hear the points of interest going around your head as if you were standing facing north on the map, centered on a latitude and longitude location. Soon, we hope to integrate Open Street Map data for intersection exploration.

Automated audio rendering

presentation of points-of-interests centered around a location


Highcharts

Line graphs

This is an example line graph taken from etherscan.io. At this time, line graphs follow a single variable, but we hope to be able to add more. Support for pie charts is also forthcoming.


Automated audio rendering

presentation of line charts


Haptics

See the video below to get a taste of the haptic renderings.